Search the Community
Showing results for tags 'UniChart'.
Found 10 results
-
Hello! How change color of this black horizontal and vertical line (not found property)?
-
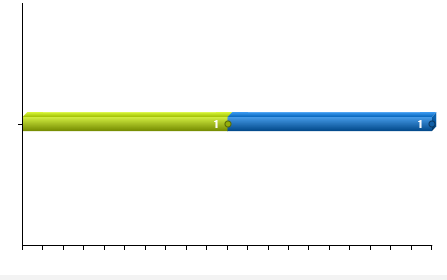
Using the last version 1.90.0.1503 so ExtJS 6.7.0 Trying to create a simple bar chart with three series, each having a unique color of red, yellow or green as each color has a specific meaning. Setting brush colors in properties has no effect. This is something quite basic and should be simple to accomplish. None of the previously posted solutions for setting series colors work as it appears the chart component is updated with latest version of ExtJS. Any ideas on how I can accomplish setting each series to a color?
-
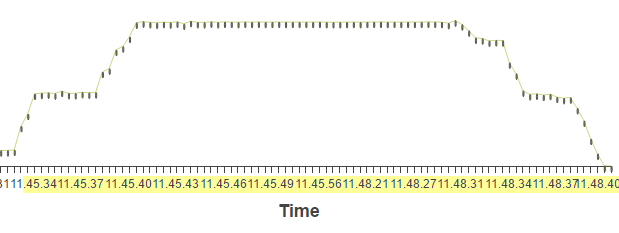
I need change the label of UniChart Axis. Graph.bmp The value is in seconds and i need change to HH:MM:SS ex 1800 sec -> 00:46:40
-
Hi everyone, yesterday I started working with the TUniChart component, I've only a little problem: How can I create a Chart with only one BarSerie with columns of different colors? At this moment I only undestanded how to insert different Series and color them, but it doesn't fit for my case. Thanks for answers and best regards.
-
Merhaba, Unichart serisinin title değerini runtimeda aşağıdaki kodu kullanarak değiştimek istiyorum ancak olmuyor. Runtimeda title değerini nasıl değiştirebilirim? series1.Title:='Deneme';
-
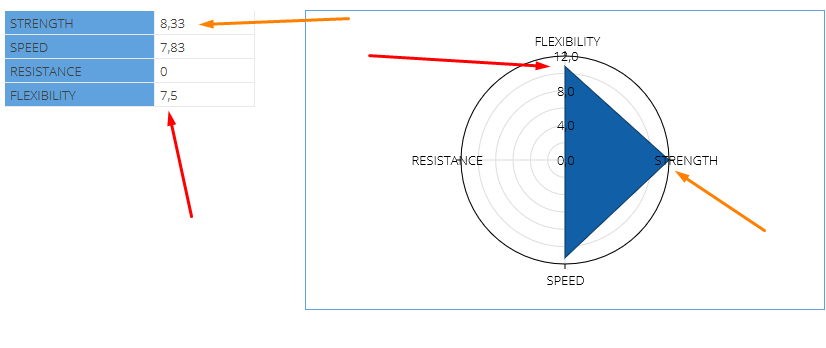
Hi everybody, does anyone face a problem with the way that uniradarseries shows values; For better understanding see the attached picture. There is a uniradarseries having opacity 0 and value 10 and another uniradarseries having the specific values on the grid at the right of the picture. e.g. Flexibility 7,5 but on the uniradar is a lot of above 8. Regards
-
Hi, I need to set YAxes label of a UniChart to be vertical. I need to show time and labels overlap (See attached image). Sencha has this feature. Thanks.

-
Hi, I couldn't find zoom-in, zoom-out and reset-zoom in TUniChart. Could you please add these three features? Thanks.
-
Hey, I noticed that the charting seems SLOW. If I have less than 50 items or so, it seems "reasonable". Not fast, but acceptable. But if I have 300 points, then WOW, it's slow. And if I add several series then it's a magnified slowness. Basically, I have a stock chart with 5 series in it. The differeent series keep track of different kinds of data over the same date range. I keep track of ONE YEAR (365 days) of data. It takes about 6 seconds for the graph to build and unlock the web page. So, if I have built the chart it takes a while to show it completly. OR if the chart is in a TAB, and I switch tabs to a non chart tab, it is fast, THEN I switch BACK to the chart with many points, THEN i have to wait many seconds before I can click on other things. Have you any experience in this? I turned off animate and it didn't make "much" of a difference. Seems like a lot of people would be complaining about this. Davie P.S. I edited out EXTREMELY and SUPER slow... to be more accurate.
-
Hi Farshad, after each upgrade uniGUI in Delphi XE3 I must rewrite header in the file uniChart.pas follows: interface uses {$IF CompilerVersion > 22} VCLTee.Chart, VCLTee.TeEngine, VCLTee.TeeProcs, VCLTee.Series, {$ELSE} Chart, TeEngine, TeeProcs, Series, {$IFEND} Classes, SysUtils, UniPanel, uniGUIRTTI, uniGUIConst, UniGUIClasses, ExtPascal, Ext, ExtChart, ExtData, UniGUIApplication, UniExtUtils, Controls, UniGUITypes, UniGUIFont, Windows; For compatibility with the new delphi I recommend this form.