

stone feng
-
Posts
99 -
Joined
-
Last visited
-
Days Won
2
Content Type
Profiles
Forums
Events
Posts posted by stone feng
-
-
Very good Arvin Feng !!! Thank you.
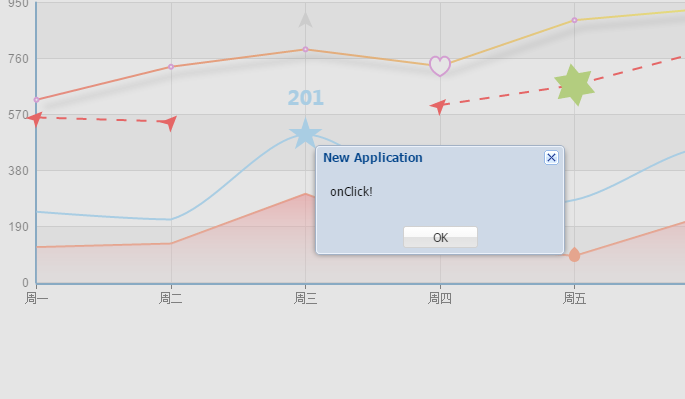
Know you how to add a onClick event over a serie?
Will be usefull when a user click over a serie and a callback event call unigui to show a grid with details.
update.
-
LoadModule isapi_module modules/mod_isapi.so


AddHandler isapi-handler .dll

<Directory "D:/Arvin/MyProduct/DPMS/Source/FrontUI/Win32/Release">

  Options Indexes FollowSymLinks ExecCGI

  AllowOverride None

  Allow from all

</Directory>

Alias /ws "D:/Arvin/MyProduct/DPMS/Source/FrontUI/Win32/Release"
hi, Farshad
Everything is working fine for apache2.2, bug not working for apache2.4.
why ? thx.
-
Hi
I get this error:
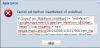
[MODULE_MISS]"zrender/tool/color" is not exists!
I have downloaded ZRender, but I'm unsure on where to install the required files.
Please advise.
Regards
Fixed.
-
Hi Arving, great charts!!
I compiled in Delphi 2006 and I'm getting this error:
[Pascal Fatal Error] Main.pas(9): F1026 File not found: 'System.Generics.Collections.dcu'
Some clues? please.
delete System.Generics.Collections unit in main.pas
-
-
 4
4
-
-
-
Thank.
-
Thank.
-
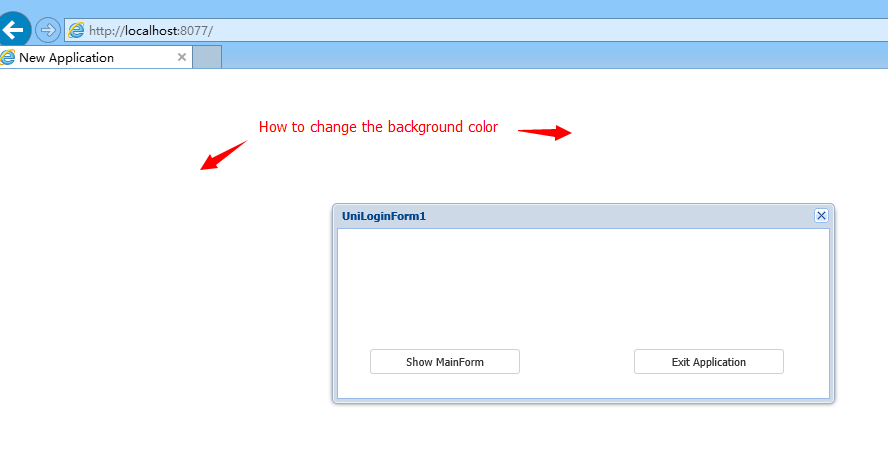
hi,
LoginDemoProject
How to change the background color ?
-
Nice Work.
Mark
-
-
Copy the markerclusterer_compiled.js and markerwithlabel_packed.js in the /files directory .
it works fine again.

thank you.
-
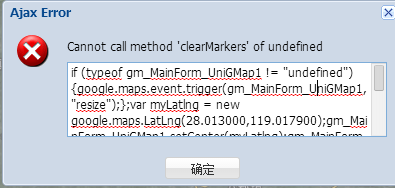
hi lema
My project no problem with uniGMap.v.1.3.5, but i got these error "Cannot call method 'clearMarkers' of undefined" with 1.3.6 version.
Thanks!
-
Hi,The function GetNextChild of a TUniTreeNode is now missing, I need use GetNextChild function.Thanks.
-
Has received License。

Thanks Farshad.
-
-
Hi Arvin,
With the version I'm sending it worked.
Then I did some more tests and got with the current version of highchart, I think the problem was with the file .js.
Now I'll create a class to facilitate the creation of the graph.Also need to figure out what I need to change when the uniframehtml is another formframe as well only works when it is in the main.ThankshugsI think the problem maybe with the version higtchart.
-
UniServerModule.CustomFiles with:files/Highcharts/jquery-1.4.4.min.jsfiles/Highcharts/highcharts.jsfiles/Highcharts/modules/exporting.js
-
Here is my code snippets
UniHTMLFrame.html with:
<div id="container" style="width:98%; height:100%"></div>...
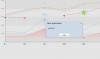
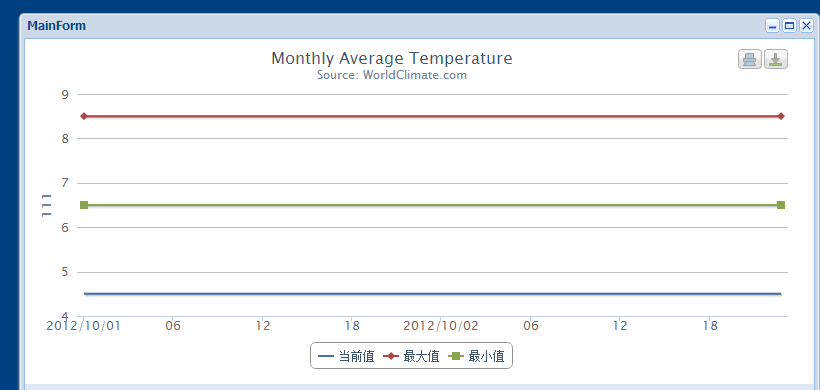
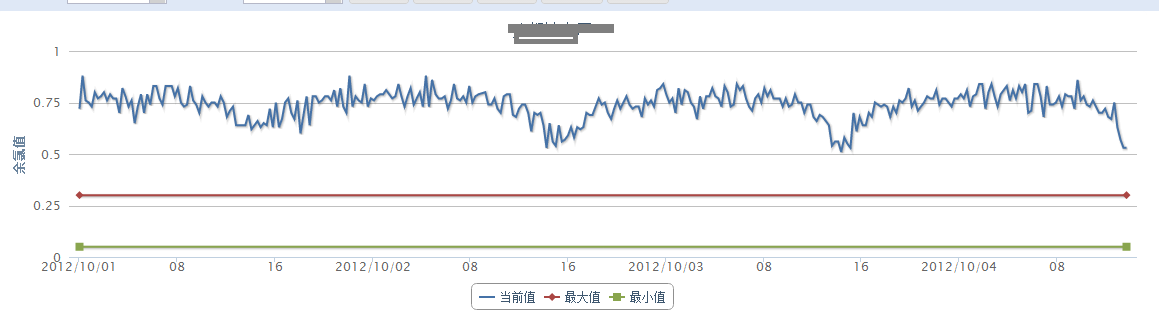
script := TStringList.Create;tryscript.Add('Highcharts.setOptions( {');script.Add(' global : {');script.Add(' useUTC : false');script.Add(' }');script.Add('});');script.Add('var chart;');script.Add('$(document).ready(function() {');script.Add(' chart = new Highcharts.Chart({');script.Add(' chart: {');script.Add(' renderTo: ''container''');script.Add(' },');script.Add(' title: {');script.Add(' text: ''Monthly Average Temperature'',');script.Add(' x: -20');script.Add(' },');script.Add(' subtitle: {');script.Add(' text: ''Source: WorldClimate.com'',');script.Add(' x: -20');script.Add(' },');script.Add(' xAxis: {');script.Add(' type: ''datetime'',');script.Add(' dateTimeLabelFormats:{');script.Add(' second: ''%M:%S'',');script.Add(' minute: ''%H:%M'',');script.Add(' hour: ''%H'',');script.Add(' day :''%Y/%m/%d'',');script.Add(' week: ''%Y/%m/%d'',');script.Add(' month: ''%Y/%m/%d'',');script.Add(' year: ''%Y''');script.Add(' }');script.Add(' },');script.Add(' yAxis: {');script.Add(' title: {');script.Add(' text: ''111''');//11111111111111script.Add(' }');script.Add(' },');script.Add(' tooltip:{');script.Add(' crosshairs : true,');script.Add(' xDateFormat : ''%Y-%m-%d %H:%M''');script.Add(' },');script.Add(' series: [{');script.Add(' name: ''当前值'',');script.Add(' type: ''line'',');script.Add(' marker:{enabled:false},');script.Add(Format(' data: %s', [data]));script.Add(' },{');script.Add(' name: ''最大值'',');script.Add(' type: ''line'',');script.Add(' data:[[1349020860000, 8.5],[1349189220000, 8.5]]');script.Add(' },{');script.Add(' name: ''最小值'',');script.Add(' type: ''line'',');script.Add(' data:[[1349020860000, 6.5],[1349189220000, 6.5]]');script.Add(' }]');script.Add(' });');script.Add('});');UniSession.AddJS(Script.Text);finallyscript.Free;end;
-
+1
-
Hi.lema,thanks for your great work.
I have a question,I want to draw province and county borders on gmap,I'm not good in googlemap api,with your uniguigmap,how should I do?
thank you!
uniGMapDemo -> "Kml Playground"
-
thanks!
-
Thanks.
-
Cool!
thx
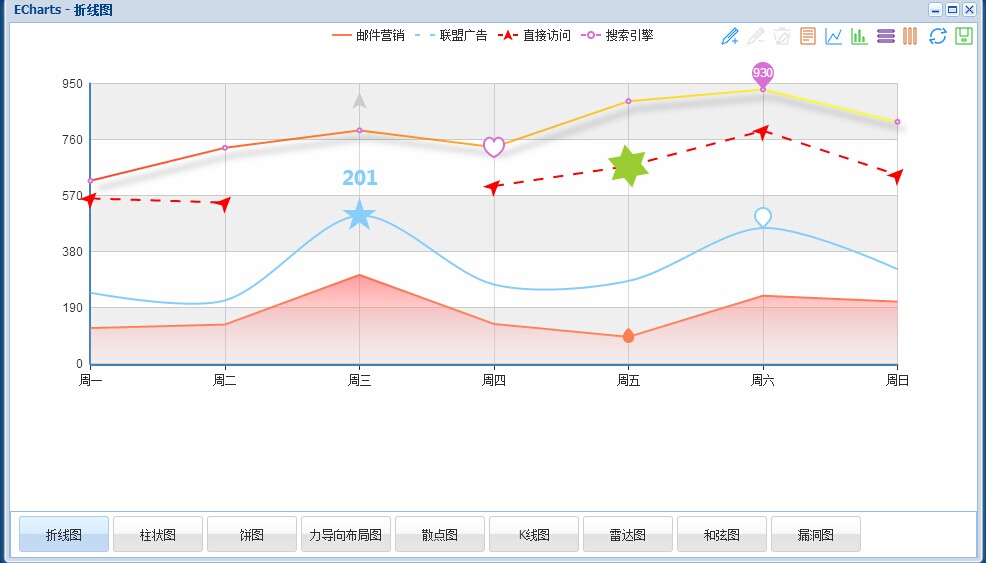
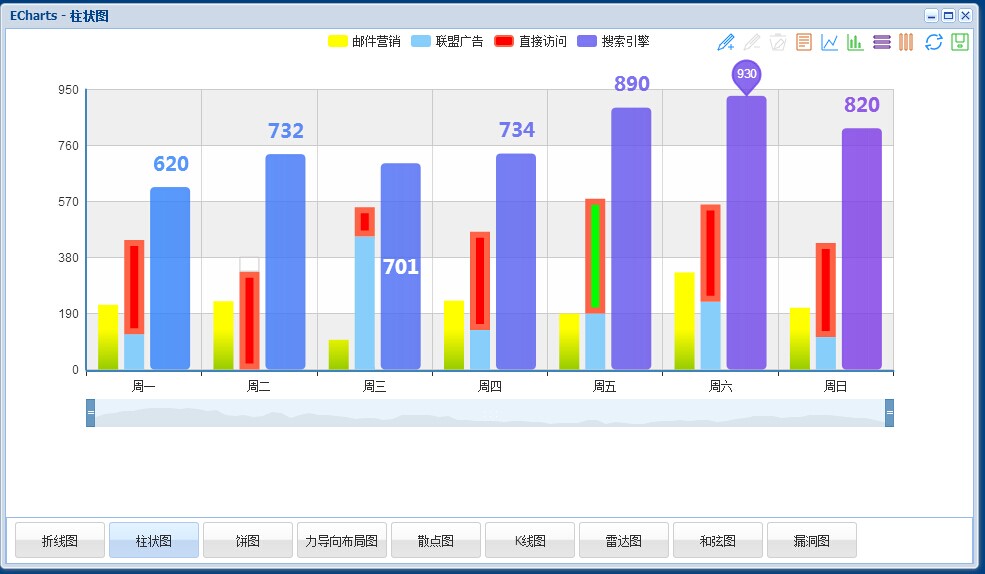
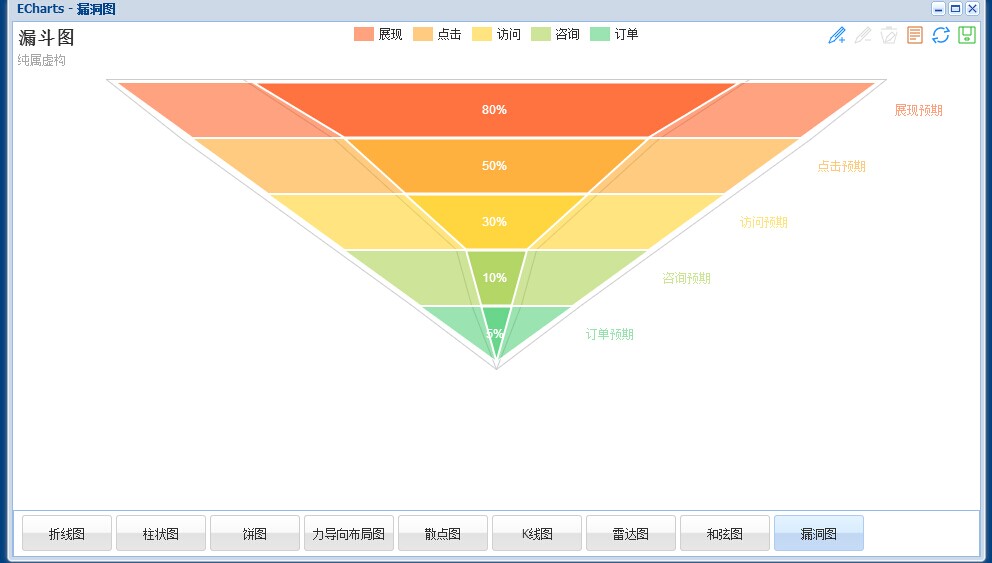
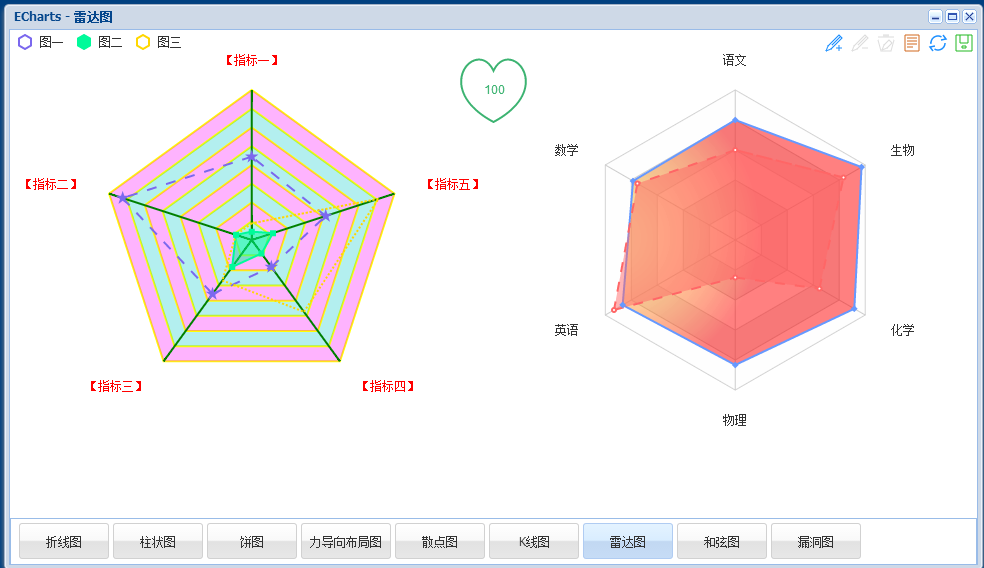
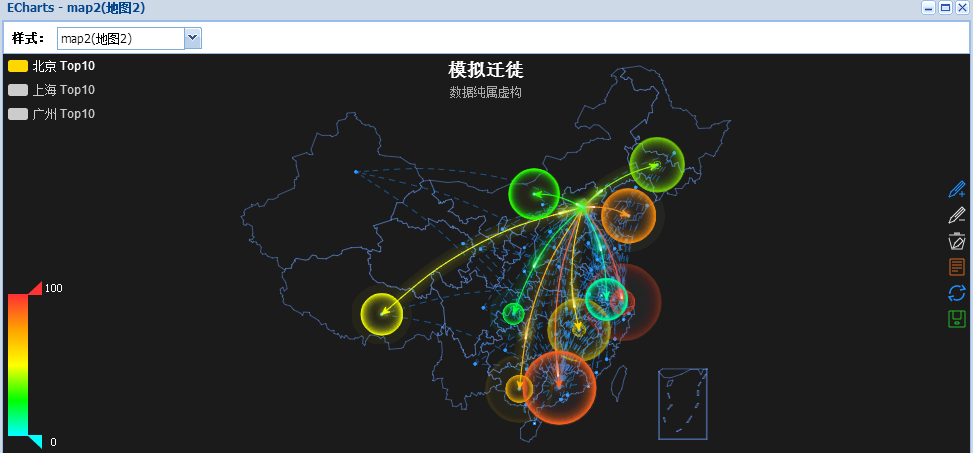
ECharts
in Sample Projects
Posted
update.