

nandrianakis
-
Posts
26 -
Joined
-
Last visited
Content Type
Profiles
Forums
Events
Posts posted by nandrianakis
-
-
Ok this is working ecxept that you must change sender.store.max('A') to sender.store.sum('A')
Thanks a lot
-
I dont know. Thats the problem
I supposed that pie chart must have a property with the percent of each value
-
I am using to display tooltip this:
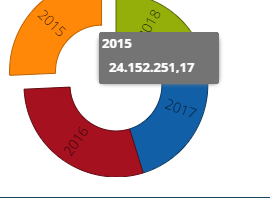
function chart.beforeInit(sender, config)
{
 config.series[0].tooltip =
  {
        trackMouse: true,
        width: 120,
        renderer: function(tip, item)
        {
            tip.setTitle(item.get('LL'));
            tip.update('<b>' + Ext.util.Format.number(item.get('A').toFixed(2),'0,000.00')+'</b>');
        }
  }
}
I need also to show the percent
for example
if the title is 2015 and value is 10000 and that is 25% of the total
Display something like this
2015
10,0000.00(25%)
-
Good morning
I need also to display the percent in tooltip(clientside).
Is this possible?
Rgs

-
OK
Thank you
-
I need to show the remain time until sessions timeout
When the timeout restores, due to request to server, the remain time will be updated accordingly
-
Good Morning
Is there any possibility to get the remaining time to the SessionTimeOut?
Rds
-
-
Good morning
Is this possible?
Rgds
-
Exactly
Thank you
-
Thank you
OK i need also to display in tooltip the title of the series as appear in legendIs this possible? -
In your code
renderer: function(tip, item) {
tip.setTitle(item.get('LL'));
tip.update('Αγορές: ' + item.get('B'));
}the parameter item has the get method with parameter 'LL' 'A' etc.
What other options there are for this parameter?
-
Goog Morning
Anything about my question?
I need also the Series title, and the percent of the pie chart
thanks
NA. -
OK this works
But i have some questions
what 'LL' means?
what more options are with item.get('something')?
where can i found the documentation?
Thanks -
-
With 2 line series is working only for the series[0]
with series[1] display values for series[0]
attached demo
-
OK perfect
Thank you
-
Good morning
I need to display, client side, label, value, percent as tooltip on a pie chart
Also on chart with 2 line series on mouseover on marker
Any idea how can i do this?
Rgs
NA.
-
Good morning
Sorry its not so easy
I found that
If I will try to open the dataset oncreate event of the form it is ok
If I place a button and open the dataset onclick event of the button is not working -
Yes
This fn
function viewready(sender, eOpts)
{
sender.getColumns()[0].renderer = function (value, metadata, record )
{
myToolTipText = "<table class='tblRecGridRowToolTip'>";
for (i=0;i< sender.getColumns().length;i++)
{
myToolTipText=myToolTipText+"<tr class='tdToolTip'>"+
"<td class='tblRecGridRowToolTipTitle'><b>"+sender.getColumns().text+": </b></td>"+
"<td class='tblRecGridRowToolTipValue'>"+record.get(i)+"</td>"+
"</tr>";
}
myToolTipText=myToolTipText+ "</table>";
metadata.tdAttr = 'data-qclass="dvQtip" data-qtip="' + myToolTipText + '"';
return value;
};
sender.getView().refresh();
}
It not works for some grids even for some records on the same grid
Any idea?
-
function viewready(sender, eOpts)
{
sender.getColumns()[0].renderer = function (value, metadata, record )
{
myToolTipText = "<table class='tblRecGridRowToolTip'>";
for (i=0;i< sender.getColumns().length;i++)
{
myToolTipText=myToolTipText+"<tr class='tdToolTip'>"+
"<td class='tblRecGridRowToolTipTitle'><b>HEADER</b></td>"+
"<td class='tblRecGridRowToolTipValue'>"+record.get(i)+"</td>"+
"</tr>";
}
myToolTipText=myToolTipText+ "</table>";
metadata.tdAttr = 'data-qclass="dvQtip" data-qtip="' + myToolTipText + '"';
alert(myToolTipText);
return value;
};
sender.getView().refresh();
}
I want to replace the word HEADER with columns header
Rgs
-
-
The latest
1.10.0.1458
-
Good morning
How can i get the title from specified column at runtime with js?
Thanks
DBGrid - Next & Previous page
in General
Posted
Is there any similar for unimdbgrid?