Search the Community
Showing results for tags 'Google Charts'.
Found 2 results
-
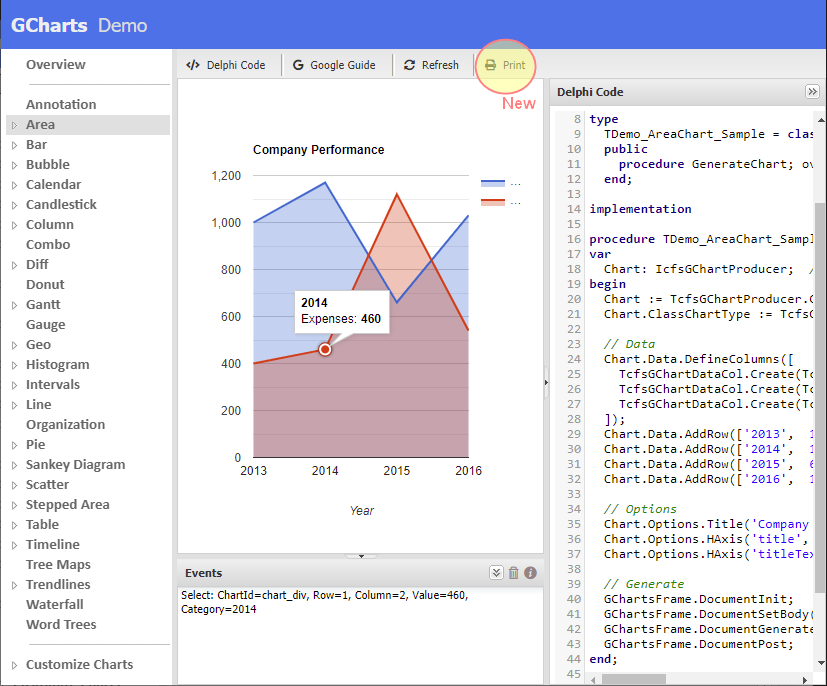
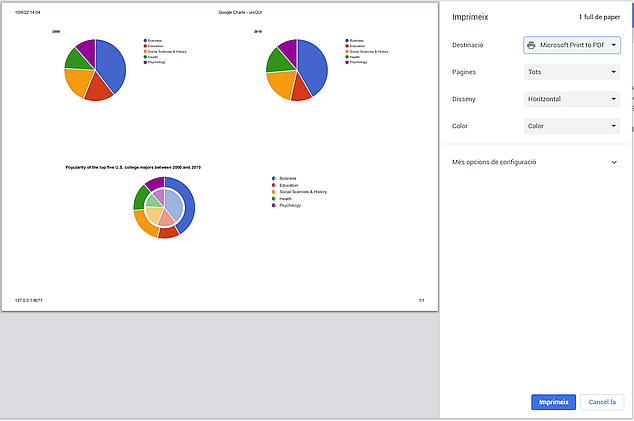
 Google Charts in uniGUI Hello, I have published in github my components to generate charts in uniGUI using de Google Charts API. The components support the following types: Annotation Area Bar Bubble Calendar Candlestick Column Combo Diff Donut Gantt Gauge Geo Histogram Intervals Line Organization Pie Sankey Diagram Scatter Stepped Area Table Timeline Tree Maps Trendlines Waterfall Word Trees The library includes in demos folder the GChartsDemo project with several examples that show how to build the different class charts. When running the demo you can: Display the Delphi Code used to generate the Chart Click Google Guide button to see the official documentation of Google Charts. Click on the Chart to see fired events (new) Click on Print button to print current frame with the chart/charts: You can get the source code in https://github.com/JosepPages7/Delphi-GCharts Please, if you use or like Delphi GCharts, "Star" this project in GitHub!
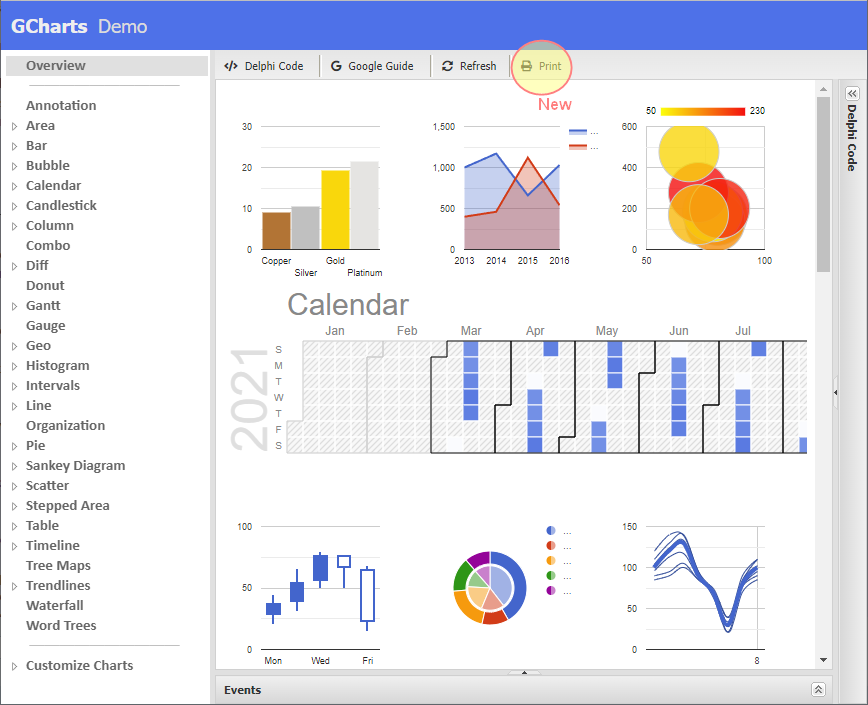
-
I load the code below into a UniURLFrame to display a Google Chart. This works great unless I put more than one UrlFrame on the same form.This is because the Google Charts bit (loaders shown in red text) should only be loaded once per web page. Can anyone tell me how to load these lines separately (AddJS? for example) <!DOCTYPE html> <html> <head> <script type="text/javascript" src="https://www.gstatic.com/charts/loader.js"></script> <script type="text/javascript"> google.charts.load('current', {'packages':['gauge']}); google.charts.setOnLoadCallback(drawGauge); var chartOptions = {min: 90, max: 100, width: 0, height: 0, redFrom: 90, redTo: 96, yellowFrom: 96, yellowTo: 99, greenFrom: 99, greenTo: 100} var theGauge; function drawGauge() { var data = google.visualization.arrayToDataTable([ ['Label','Value'] ,['All', 98.39] ]); Gauge = new google.visualization.Gauge(document.getElementById('Gauge_div')); Gauge.draw(data, chartOptions); } </script> </head> <body> <div id="Gauge_div"></div> </body> </html>