Search the Community
Showing results for tags 'highcharts'.
Found 4 results
-
In this topic , I try to share some css for you . For dear novices I will explain, you have this code in UniServerModule -- > CustomCSS Copy and assign the object to the CLS section in Layoutconfig when designing, or use this command when executing bitbtn1.JSCall('addCls', [' ...... ']); you can do if you like first, this sites can help to build css runtime https://htmlcheatsheet.com/css/
-
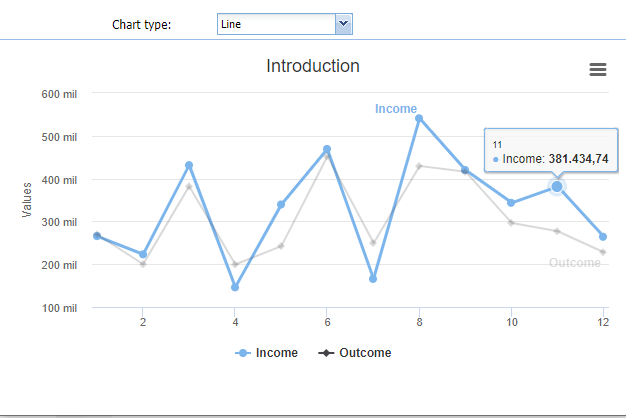
Hello everyone! A while ago I looked for a component or something that made it easy to use Highcharts in Unigui but I was unsuccessful. So I decided to develop my own component to do this. After 2 months of work is in a more stable version and decided to share with the community. I remind you that Highcharts is free for personal use only. Download from github: https://github.com/andriwsluna/Unigui-Components With this component it is possible to generate a chart with only 6 lines of code. Follow : EchoHightChart1.HighChartOptions.title.text.Value := 'Introduction'; EchoHightChart1.HighChartOptions.series.Datasource.DataSet := FDMemTable1; EchoHightChart1.HighChartOptions.series.List.FieldNameForSerie := 'Operation'; EchoHightChart1.HighChartOptions.series.List.FieldNameForX := 'month'; EchoHightChart1.HighChartOptions.series.List.FieldNameForY := 'value'; EchoHightChart1.Load; Note that there is a Datasource for data access. See demo: PM me to contribute with this project. Thanks.

-
Hi, With the Html- and AfterScript-properties of TUniHTMLFrame, I managed to obtain a nice Highcharts graph. What is the code to 'refresh' or to 'repaint' the chart, this is the contents of the TUniHTMLFrame ? Thank you in advance.
-
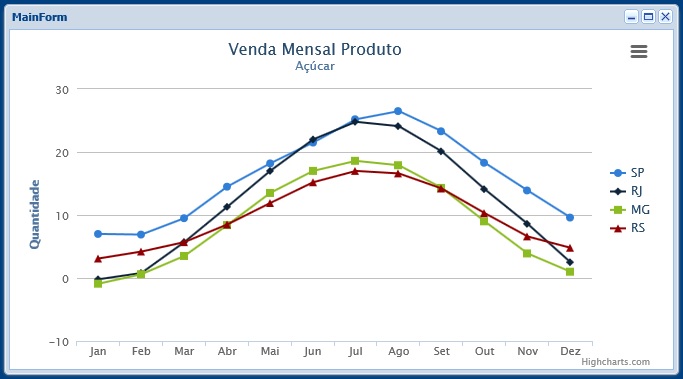
Hello everybody! I edited the post to let the solution I could with the help of Arvin. Attached Project working. Includes all the javascript uniservermodule.customfiles files / Highcharts / highcharts.js files / Highcharts / modules / exporting.js files/jquery-1.10.2.min.js Added a unihtmlframe.html with: <div id="container" style="min-width: 310px; height: 400px; MARGIN: 0 auto"> </ div> procedure TFGraficoDemo1.UniFrameCreate(Sender: TObject); var js: TStringList; begin inherited; try js := TStringList.Create; js.Add('Highcharts.setOptions( {'); js.Add(' global : {'); js.Add(' useUTC : false'); js.Add(' }'); js.Add('});'); js.Add('var chart;'); js.Add('$(document).ready(function() {'); js.Add(' chart = new Highcharts.Chart({'); js.Add(' chart: {'); js.Add(' renderTo: ''container'''); js.Add(' },'); js.Add(' title: {'); js.Add(' text: "Venda Mensal Produto",'); js.Add(' x: -20 //center'); js.Add(' },'); js.Add(' subtitle: {'); js.Add(' text: "Açúcar",'); js.Add(' x: -20'); js.Add(' },'); js.Add(' xAxis: {'); js.Add(' categories: ["Jan", "Feb", "Mar", "Abr", "Mai", "Jun",'); js.Add(' "Jul", "Ago", "Set", "Out", "Nov", "Dez"]'); js.Add(' },'); js.Add(' yAxis: {'); js.Add(' title: {'); js.Add(' text: "Quantidade"'); js.Add(' },'); js.Add(' plotLines: [{'); js.Add(' value: 0,'); js.Add(' width: 1,'); js.Add(' color: "#808080"'); js.Add(' }]'); js.Add(' },'); js.Add(' tooltip: {'); js.Add(' valueSuffix: "Qtde"'); js.Add(' },'); js.Add(' legend: {'); js.Add(' layout: "vertical",'); js.Add(' align: "right",'); js.Add(' verticalAlign: "middle",'); js.Add(' borderWidth: 0'); js.Add(' },'); js.Add(' series: [{'); js.Add(' name: "SP",'); js.Add(' data: [7.0, 6.9, 9.5, 14.5, 18.2, 21.5, 25.2, 26.5, 23.3, 18.3, 13.9, 9.6]'); js.Add(' }, {'); js.Add(' name: "RJ",'); js.Add(' data: [-0.2, 0.8, 5.7, 11.3, 17.0, 22.0, 24.8, 24.1, 20.1, 14.1, 8.6, 2.5]'); js.Add(' }, {'); js.Add(' name: "MG",'); js.Add(' data: [-0.9, 0.6, 3.5, 8.4, 13.5, 17.0, 18.6, 17.9, 14.3, 9.0, 3.9, 1.0]'); js.Add(' }, {'); js.Add(' name: "RS",'); js.Add(' data: [3.1, 4.2, 5.7, 8.5, 11.9, 15.2, 17.0, 16.6, 14.2, 10.3, 6.6, 4.8]'); js.Add(' }]'); js.Add(' });'); js.Add('});'); UniSession.AddJS(js.Text); finally js.Free; end; end; Best regards Highcharts.zip