Search the Community
Showing results for tags 'TuniChart'.
Found 8 results
-
Hi I'm not able to change legend of tunichart that describe a tuinlineseries at design time. in before show seem working (series.title:='dummy';) but i need to change the legend frequently on click button. tnks
-
I've 4 Series series in UniChart, with data for 4 years, each one is 1 year. (for anything type: area, bar, pie, scatter, radar, etc.) When mouse move over the series, and values triggers SeriesMouseOver(Sender: TUniCustomChart; Series: TUniChartSeries; Index: Integer; Value: Variant; X, Y, PageX, PageY: Integer); But always the series and Index are same, never changes. Only first serie is recognizing. I need the others too.! I try with tooltips in javascript (from Delphi): //graphic1 is TuniChart component graphic1.ClientEvents.UniEvents.Add( 'chart.beforeInit=function chart.beforeInit(sender, config){'+ ' config.innerPadding = {left: 4,right: 5};'+ ' if (config.series.length) { '+ ' for (i = 0; i < config.series.length; i++) {'+ ' config.series[i].tooltip = {'+ ' trackMouse: true,'+ ' width: 150,'+ ' renderer: function(tip, item) {'+ ' tip.setTitle(item.get(''LL''));'+ ' tip.update(''Valor: '' + item.get(String.fromCharCode(65+i)));'+ ' }'+ ' }'+ ' }'+ ' }'+ '}'); But when mouse moves over the graphic... only values from 1 serie shows, and same value when moving over anothers series. How can catch de current serie and current value?
-
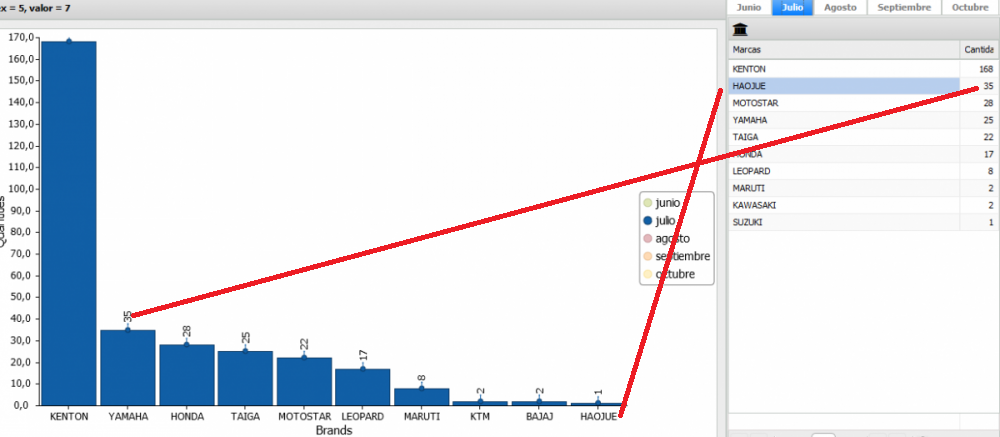
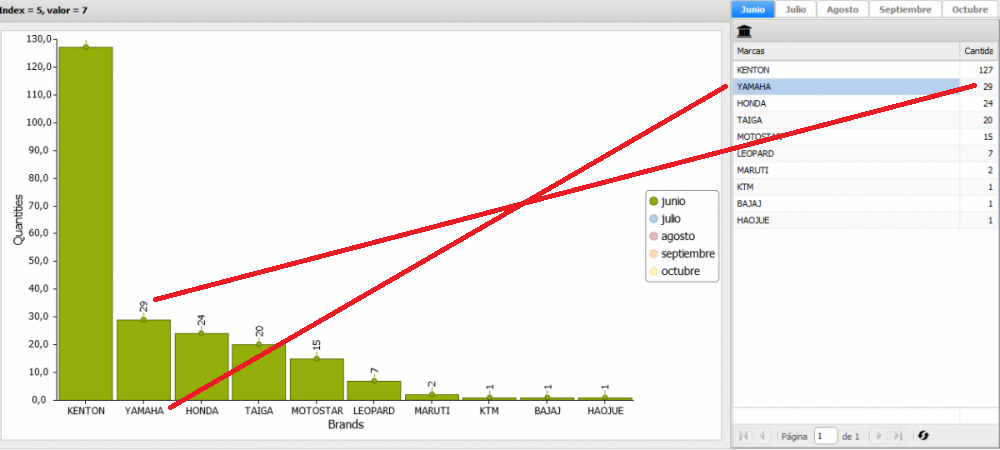
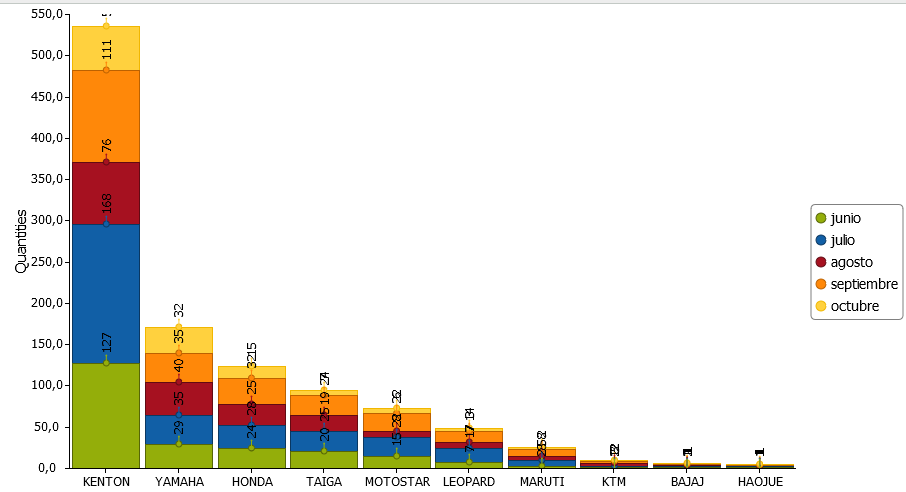
Ex. SeriesBar.. Make series by month: X are brands and Y quantities. Each serie refers to a datasource. Img1: Shows data from June. Note Yamaha is 2nd. and HaoJue 10th. Img2: Show July: Note Haojue now is the second, and Yamaha the 4th... But graphic shows same order that previous month!. Doesn´t refresh the order If select all months. Note HaoJue: Always is the last, and the quantity, the last quantity in each serie! The values form Haojue are: qty Month ================= HAOJUE 1 Junio HAOJUE 35 Julio HAOJUE 7 Agosto HAOJUE 22 Septiembre HAOJUE 2 Octubre When shows both or all months in series, never changes the order, and the information is bad presented. Is it a bug or there is another way to configure the values?
-
Hi, I'm building a graph using Tunichart, but I can not get the legend to show all the items, I tried to reduce the font size, but it's still not right,
-
Hi, Is there any way to put two Y-axes in a TUniChart (for example, left and right)? I need this because I have two series with very different orders of magnitude, Then one will appear in the lower corner of the graph and another in the upper corner, unless I use two axes with different scales. Thanks in advance!
-
Hi, We have a couple of charts in one of the our programs. A example chart shows number of calls made for each agent. The issue is that even though I put integer values into the series var y: integer; ... y := Trunc(series_data.m_y); UniBarSeries2.Add(y, series_data.m_x); the user will see 0, 0.5, 1, 1.5, etc. on the y-axis. Is there some way to make the charts only display whole (integer) numbers? Thanks.
-
 Hello all; I have had an issue for qute some time and just now figured out what's going on. SYMPTOM: A TuniChart line graphs looks garbled<junk> when some panels have their visible property changed in the main form's OnCreate method. If i remove these visible property changes from the OnCreate, then the uniChart looks perfect. Very odd. It only happens to a chart sitting on a PageControl tabl. It does NOT happen to a chart sitting in TabControl tab. And it does NOT happen, when it's just sitting on the main form. Very wierd. uniGUI ver 1.0.0.1385 (bug has existed for over a year) FireFox (all versions that I've tested, including 52.1.0 <32bit> ) Another odd thing, is that it works on some older versions of InternetExplorer. Haven't tested on newer versions. AND it works on my latest CHROME version as well. It seems to be isolated with FireFox. I have a ZIP file that contains the test project that shows the problem. But I don't know where to place the ZIP file. I thought I could just attach it to this message, but I don't see how to do it. Darn, I can't find how to upload attachment. Here is the main.pas file I wonder if anybody knows what's going on with this strange interaction. Thanks Davie
 -
Hey, I noticed that the charting seems SLOW. If I have less than 50 items or so, it seems "reasonable". Not fast, but acceptable. But if I have 300 points, then WOW, it's slow. And if I add several series then it's a magnified slowness. Basically, I have a stock chart with 5 series in it. The differeent series keep track of different kinds of data over the same date range. I keep track of ONE YEAR (365 days) of data. It takes about 6 seconds for the graph to build and unlock the web page. So, if I have built the chart it takes a while to show it completly. OR if the chart is in a TAB, and I switch tabs to a non chart tab, it is fast, THEN I switch BACK to the chart with many points, THEN i have to wait many seconds before I can click on other things. Have you any experience in this? I turned off animate and it didn't make "much" of a difference. Seems like a lot of people would be complaining about this. Davie P.S. I edited out EXTREMELY and SUPER slow... to be more accurate.