VojkoCendak
-
Posts
19 -
Joined
-
Last visited
-
Days Won
1
Content Type
Profiles
Forums
Events
Everything posted by VojkoCendak
-
Hi, Websockets example full. The stringgrid is updated from websocket message event (ClientEvents...). But if I want to read cell values from code values from cell[] are empty. How can we get to the data in grid ? The same problem is with any control that's updated from JavaScript. thank you, Vojko
-
Access is fast enough (can be lightning fast with oledb), stable and quite usable except for 2G size limit. Concurrency: works ok. The major difficulty for us is if you have several connections to access db, the changes made in one connection don't reflect immediately in other connections or apps. It could take couple of seconds. Anyway concurrency it's not deterministic (atomic operations) if you need that. It's even more stable then SQlite from our experiences. regards, Vojko
-
Hi, latest 1560 When we open xlsx document in excell or libreoffice the cell value has also like apostrophe character in front of text: displayed number is 1111, when I press F2 it displays '1111 !? When we delete ' it converts to number and does calculations. Is this a bug ?
-
Better whole function also for TDataSource: function TUniCustomChart.ChartDataToStr(AChartSeries: TUniChartSeries; ADim: Integer): TUniStringArray; var I, xCount : Integer; Ds : TDataSet; S, Val : string; fVal : Double; begin // ADim // 0 = Text Data, // 1 = Numeric Data with AChartSeries do begin if Assigned(FDataSource) then begin if Assigned(FDataSource.DataSet) and FDataSource.DataSet.Active then begin Ds := FDataSource.DataSet; xCount := Ds.RecordCount; if FYValues.FValueSource <> '' then begin DS.DisableControls; try Ds.First; SetLength(Result, xCount); for I := 0 to xCount - 1 do begin case ADim of 0 : begin if FXLabelsSource <> '' then begin if Ds.FieldByName(FXLabelsSource) is TNumericField then Result[I] := fVal2Float(Ds.FieldByName(FXLabelsSource).AsFloat) else Result[I] := StrToJS(Ds.FieldByName(FXLabelsSource).AsString) end else Result[I] := StrToJS(IntToStr(I)); end; 1 : begin if Ds.FieldByName(FYValues.FValueSource).IsNull then // new null *** Result[I] := 'null' else begin fVal := Ds.FieldByName(FYValues.FValueSource).AsFloat; Val := fVal2Float(fVal); Result[I] := Val; end; end; end; Ds.Next; end; finally Ds.EnableControls; end; end; end end else begin SetLength(Result, ValuesList[0].Count); for I := 0 to ValuesList[0].Count - 1 do begin case ADim of 0 : begin S := XLabel[I]; if (S = '') or (S = '""') then // in case no label is provided S := StrToJS(IntToStr(Trunc(ValuesList[0].Value[I]))); Result[I] := S; end; 1 : begin if VarIsNull(ValuesList[1].Value[I]) then // new null *** Result[I] := 'null' else begin fVal := ValuesList[1].Value[I]; Val := fVal2Float(fVal); Result[I] := Val; end; end; end; end; end; end; end;
-
We saw at Ext 7 Sencha fiddle, that if you add null instead of number, chart skips drawing point. just change value let's say 17 -> null ! voila Would that be hard to implement ? Regards, Vojko
-
Hi, is it possible to align TeeChart alclient and respond to window (parent) resize event ? thank you, Vojko
-
did you find any solution ? thank you, Vojko
-
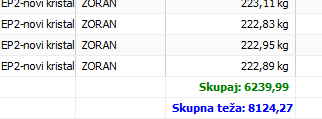
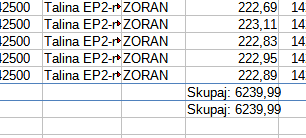
Grid export problem with SummaryTotal in all export types
VojkoCendak replied to VojkoCendak's topic in General
thank you, hope you'll fix it soon. for now we'll use it without Total. Are there sources for export components? regards, Vojko -
HI, (1.90.0.1545) Here is UniDBGrid with grouping Group with Total: This is OK ! Here, SummaryTotal in excell file is wrong ! (also in other export types) This is wrong. thank you
-
Hi, try https://delphihtmlcomponents.com/ they work also for Lazarus and FMXlinux. regards, Vojko Cendak
- 1 reply
-
- 1
-

-
what Resources/Handles mean from server console
VojkoCendak replied to VojkoCendak's topic in General
Hi, Can we track handles in UniGui ? What are exactly handles in unigui ? When the handles reach max server stops. thank you -
Hi, (Rio 10.3.3, UniGui Professional_1.90.0.1517) Handles are slowly getting from 400 to 1000. We don't know what they mean. Thank you , Vojko Cendak
-
Hi, We have in db DateTime field with Float values: 25.9.2019 00:00:00 1.2 25.9.2019 00:01:00 6.0 25.9.2019 00:02:00 null (empty in record) - we don't want to draw it on chart 25.9.2019 00:03:00 1.9 25.9.2019 00:04:00 1.1 ... How can we NOT display 3. record point and that the line between 2 and 4 is not drawn ? Is this actually possible ? We saw something in ExtJS useNull option . This is important for us to use, because the user needs to see that values are missing. We use this in VCL TeeChart succesfuly. Thank you, Vojko Cendak
-
Yes and DisplayFormat is different then in the dbgrid: it's "dd.mm.yyyy hh:nn:ss" instead of "dd.mm.yyyy hh:nn". thank you
-
change unichart left axis font size & format number
VojkoCendak replied to donlego's topic in General
Have you succeded ? thank you -
Hi, could you please have a look ? thank you
-
test case with corrected uses units. If there are any just delete them. UniGui test fmsoft.zip
-
Hi, (UniGuiComplete pro 1.90.0.1508, Delphi XE5 pro, Win7 pro) 1. We have a chart connected to db dataset with TDateTime field. The field has Display format: 'd.m.zyy h:n'. The unidbgrid displays format ok, but chart displays d.m.yyy hh:nn:ss - 1.9.2019 14:22:12. Is this OK ? 2. How can we set datetime format on AxisB in two lines ?: date top and time bottom and maybe control angle of labels ? 3. How can we setup major ticks and minor ticks: chart is not affected by it ? thank you , Vojko Cendak
-
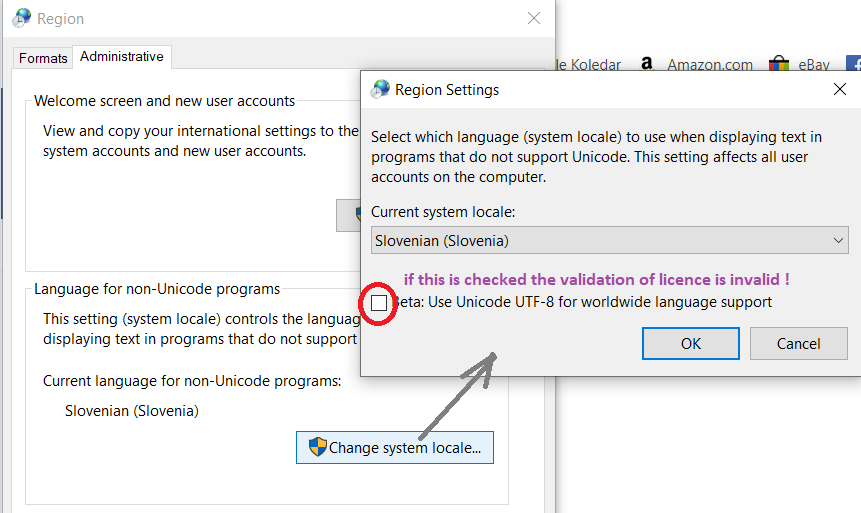
Hi everyone, there is an error when Use Unicode UTF-8 is checked. I thought it was new version of Windows 10pro version 1903, but it's the same with older ones version 1803, I think. Hope it will help others. Hopefully it doesn't affect the runtime programs. Wish you all the best, Vojko Cendak
- 1 reply
-
- 2
-
-