jptec
-
Posts
36 -
Joined
-
Last visited


jptec's Achievements
Newbie (1/4)
0
Reputation
-
I've used a testing tools named BurpSuite and report the following issue: A JavaScript framework or library is a set of tools and functions that make it easy to generate cross-browser compatible JavaScript code. If a website uses a JavaScript framework or library with vulnerabilities, attackers can use this vulnerability to hijack the user's browser and carry out such attacks as horse hijacking, XSS, and Cookie hijacking. The test address: http://114.xx.xx.xx:8077/uni-1.90.0.1560/jQuery/jquery-1.11.2.min.js please attached picture for reference. Risk level: [Medium risk] Risk analysis: Attackers can use this vulnerability to hijack the user's browser and carry out horse, XSS, Cookie hijacking Security tip: Upgrade the affected javascript framework library to the latest version. Please advise how to solve

-
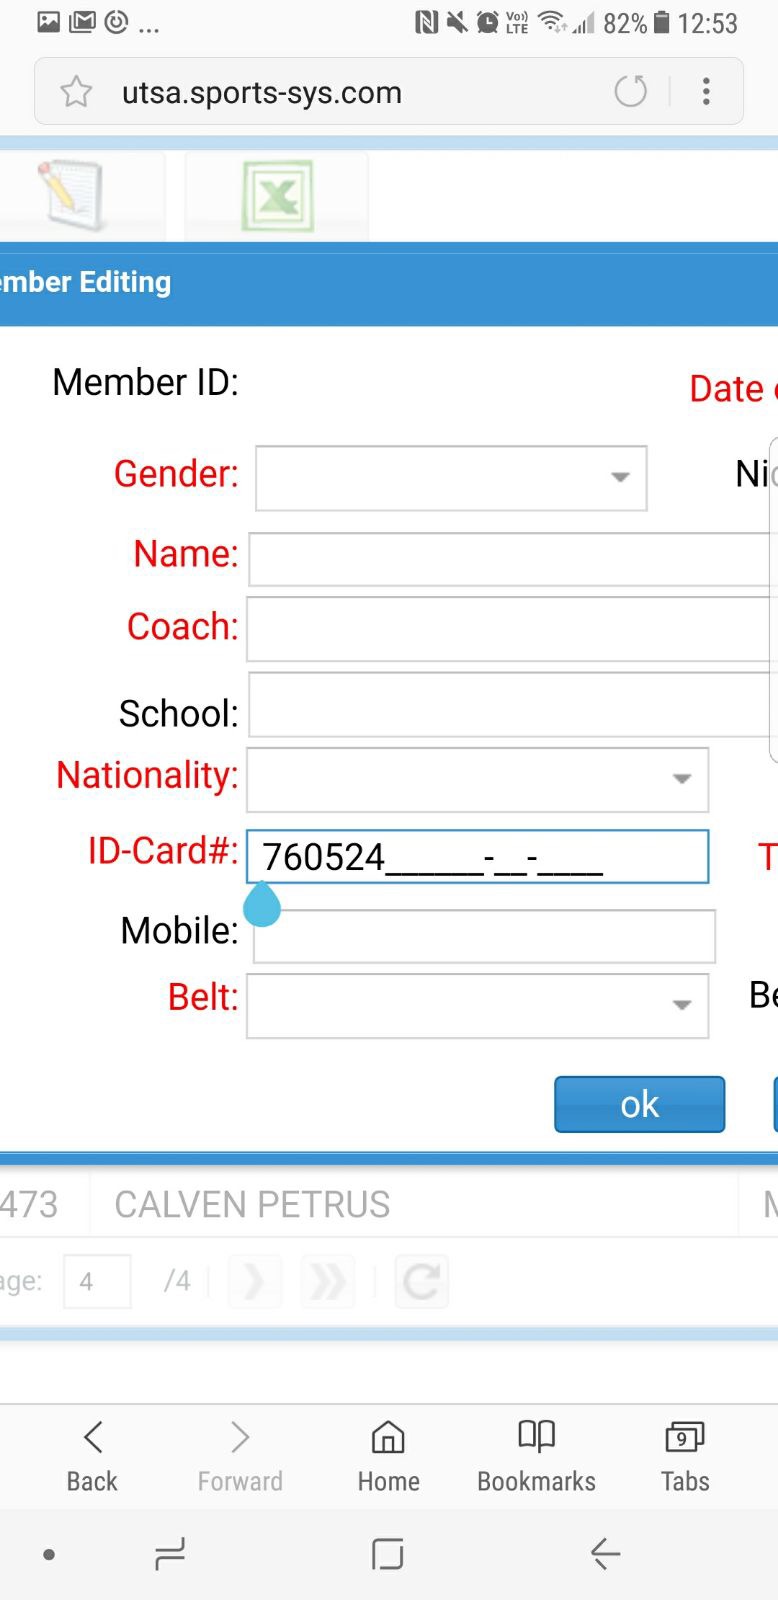
Hi, I develop a desktop version application. If use at pc browser, it is working correctly. However if the app open at the andriod phone browser(especially at samsung model, Chrome and build in samsung ), the edit mask is not correct. You can find in the attachment. It wont fill up the mask. Just make the mask moving towards right hand side. But this also working correctly at iphone. Below is the control setting: object UniDBEdit17: TUniDBEdit Left = 129 Top = 220 Width = 203 Height = 22 Hint = '' DataField = 'IOP_IDENT' DataSource = dadsData TabOrder = 19 InputMask.Mask = '******-**-****' end Please advise how to solve
-
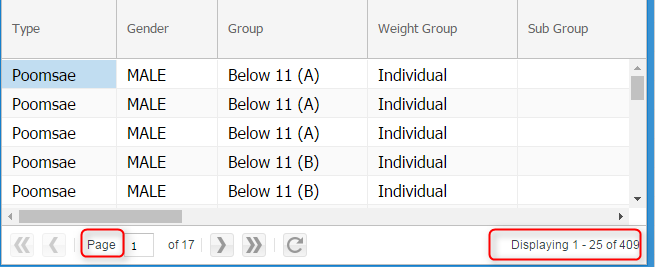
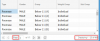
Hi, I would like to change the grid page information displaying to others terms. I want to change it style or any way so that I can change all the unidbgrid in my application. Please see the attached for the part I want to change. Please advise joe
-
Hi All, I use htmlframe's afterscript to set a other framework jquery plugin button property: in TUniHTMLFrame- AfterScript I put below script $(function(){ $("#buttonContainer").dxButton({ text: "Click me!", onClick: function () { ajaxRequest(MainForm.form,"INDEX-HOME" , ["" ]); } }); }); But I cannot receive the onajaxevent in Main form. I think I did something but I cant find it. Any Advise? also can anyone explain the usage on beforescript and afterscript Joe
-
Looks Great, if can linkup dataset and print and save back to the dataset. Looking forwards to update so that I can integrate to our project. Joe
-
Any support email, send to you directly? as the javascript component is licensed. it cannot post in here.
-
anyone can advise?
-
Thank your hints. I searched previous way to do it: with (UnimHTMLFrame1 as IUniJSInterface) do begin JSCall('element.setStyle', ['background-image', 'url("/img/mobile-menu/bg.png")']); JSCall('element.setStyle', ['background-repeat', 'no-repeat']); JSCall('element.setStyle', ['background-size', 'cover']); end; If have better solution , Please advise but above already set the background. Thanks
-
hi, Thanks you for your suggestion. But boxready is only found at desktop version unihtmlframe. In mobile version, unimhtmlframe no that function. Any suggestion to achieve in mobile version?
-
Hi, Want to confirm the following case: <html> <body style="background: url('/img/mobile-menu/bg.png'); background-repeat:no-repeat; background-size: cover;"> <center> <a href="#" onclick="javascript:ajaxRequest(MainmForm.form,'STATISTIC' , [parameter='1' ])" >bbbb</a> <a href="#" onclick="javascript:ajaxRequest(MainmForm.form,'RANKING' , [parameter='2' ])">cccc</a> <a href="#" onclick="javascript:ajaxRequest(MainmForm.form,'COMMENT' , [parameter='3' ])" >dddd</a> <a href="#" onclick="javascript:ajaxRequest(MainmForm.form,'TUTORIAL' , [parameter='4' ])" >eeee</a> </center> </body> </html> In TUnimHTMLFrame: it CANNOT show the background image but can capture onclick event in UnimFormAjaxEvent. In TUnimURLFrame: it can show the background image but CANNOT capture onclick event in UnimFormAjaxEvent. The above statement , is it correct? Actually I need show a background image in htmlframe, can I achieve it? what is difference bwtween TUnimHTMLFrame and TUnimURLFrame? As I check only TUnimURLFrame come with URL property , can go to URL? Any others? Thanks you Joe
-
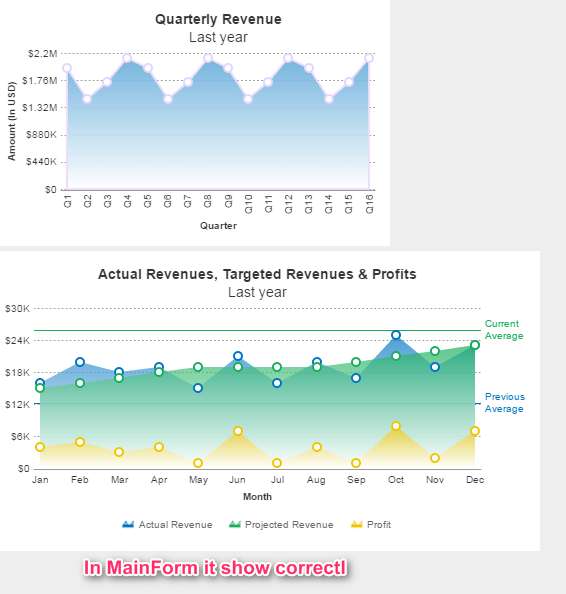
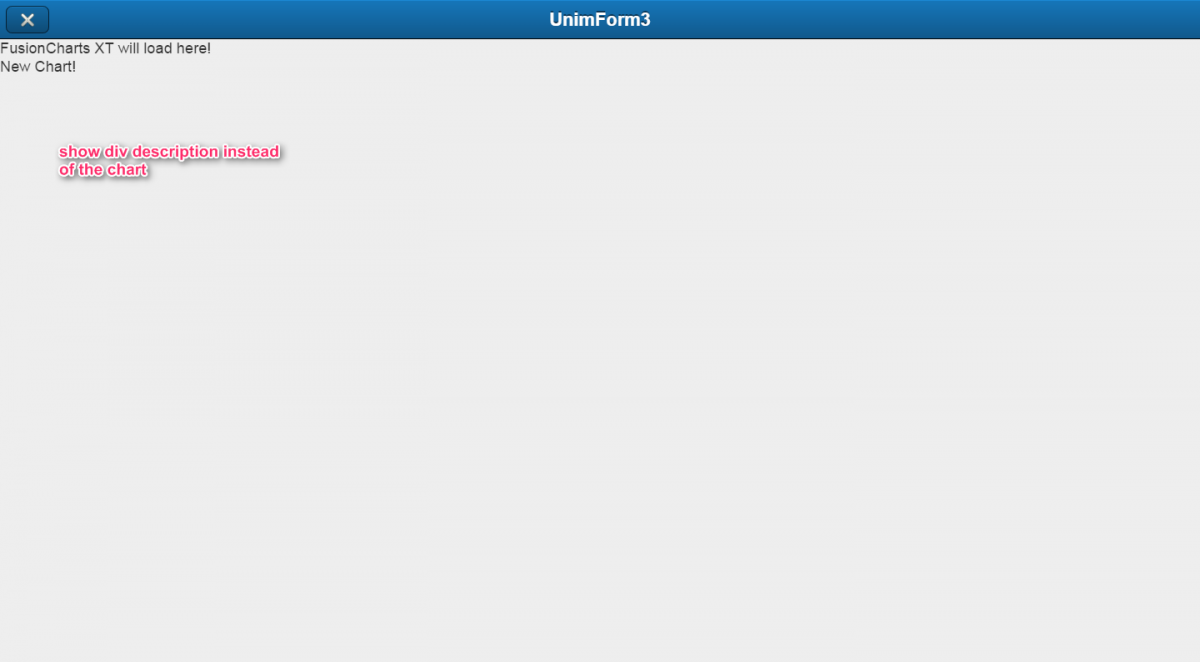
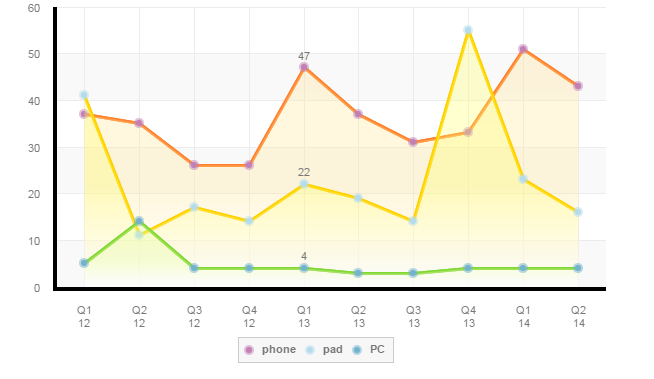
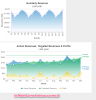
HI, I've integrated a fuschart into our project. In My Testing all chart put in application main form. It can render correctly. My setup is using TUnimHTMLFrame.Html and TUnimHTMLFrame.BeforeScript. it is working perfect in Main form. If put that TUnimHTMLFrame into other form. In Main form use button click to show that form it wont show the chart. it only show the html tag. This is the TUnimHTMLFrame html property <html> <body bgcolor="#D26A02" > <div id="chartContainer2">FusionCharts XT will load here!</div> <div id="chartContainer3">New Chart!</div> </body> </html> This is TUnimHTMLFrame.BeforeScript. FusionCharts.ready(function(){ var revenueChart = new FusionCharts({ type: 'area2d', renderAt: 'chartContainer2', width: '400', height: '250', dataFormat: 'json', dataSource: { "chart": { "caption": "Quarterly Revenue", "subCaption": "Last year", "xAxisName": "Quarter", "yAxisName": "Amount (In USD)", "numberPrefix": "$", "theme": "fint", "showPlotBorder": "1", "plotBorderThickness": "2", "anchorBorderColor":"#E1D6FC", "anchorBgHoverColor":"#aa2911", "anchorRadius": "4", "anchorBorderThickness": "2", "showshadow": "0", //Using plot gradient color "usePlotGradientColor": "1", "plotBorderColor":"#EEDDFC", "plotFillColor":"#66acda", //Applying plot gradient color "plotGradientColor": "#FFFFFF", //Applying fill angle for plots "bgColor": "#23b14d", "bgAlpha": "0", "showValues": "0", "canvasBgAlpha": "0", "plotFillAngle": "90", //Applying fill ratio for plots "plotFillRatio": "20,70" }, "data": [{ "label": "Q1", "value": "1950000" }, { "label": "Q2", "value": "1450000" }, { "label": "Q3", "value": "1730000" }, { "label": "Q4", "value": "2120000" },{ "label": "Q5", "value": "1950000" }, { "label": "Q6", "value": "1450000" }, { "label": "Q7", "value": "1730000" }, { "label": "Q8", "value": "2120000" },{ "label": "Q9", "value": "1950000" }, { "label": "Q10", "value": "1450000" }, { "label": "Q11", "value": "1730000" }, { "label": "Q12", "value": "2120000" },{ "label": "Q13", "value": "1950000" }, { "label": "Q14", "value": "1450000" }, { "label": "Q15", "value": "1730000" }, { "label": "Q16", "value": "2120000" } ] } } ); var fusioncharts = new FusionCharts({ type: 'mscombi2d', renderAt: 'chartContainer3', width: '550', height: '300', dataFormat: 'json', dataSource: { "chart": { "caption": "Actual Revenues, Targeted Revenues & Profits", "subCaption": "Last year", "sYAxisName": "Amount (In USD)", "xAxisname": "Month", "sYAxisNameFont": "Arial", "sYAxisNameFontSize": "12", "sYAxisNameFontColor": "#003366", "sYAxisNameFontBold": "1", "sYAxisNameFontItalic": "1", "sYAxisNameAlpha": "50", "numberPrefix": "$", "usePlotGradientColor": "1", "plotGradientColor": "#FFFFFF", "anchorRadius": "4", "anchorBorderThickness": "2", "plotFillAngle": "90", "plotFillRatio": "20,70", "showPlotBorder": "0", "plotBorderThickness": "2", "theme": "fint" }, "trendlines": [{ "line": [{ "startvalue": "12250", "color": "#0075c2", "displayvalue": "Previous{br}Average", "valueOnRight": "1", "thickness": "1", "showBelow": "1", "tooltext": "Previous year quarterly target : $13.5K" }, { "startvalue": "25950", "color": "#1aaf5d", "displayvalue": "Current{br}Average", "valueOnRight": "1", "thickness": "1", "showBelow": "1", "tooltext": "Current year quarterly target : $23K" }] }], "categories": [{ "category": [{ "label": "Jan" }, { "label": "Feb" }, { "label": "Mar" }, { "label": "Apr" }, { "label": "May" }, { "label": "Jun" }, { "label": "Jul" }, { "label": "Aug" }, { "label": "Sep" }, { "label": "Oct" }, { "label": "Nov" }, { "label": "Dec" }] }], "dataset": [{ "seriesName": "Actual Revenue", "parentYAxis": "S", "renderAs": "area", "data": [{ "value": "16000" }, { "value": "20000" }, { "value": "18000" }, { "value": "19000" }, { "value": "15000" }, { "value": "21000" }, { "value": "16000" }, { "value": "20000" }, { "value": "17000" }, { "value": "25000" }, { "value": "19000" }, { "value": "23000" }] }, { "seriesName": "Projected Revenue", "renderAs": "area", "parentYAxis": "S", "showValues": "0", "data": [{ "value": "15000" }, { "value": "16000" }, { "value": "17000" }, { "value": "18000" }, { "value": "19000" }, { "value": "19000" }, { "value": "19000" }, { "value": "19000" }, { "value": "20000" }, { "value": "21000" }, { "value": "22000" }, { "value": "23000" }] }, { "seriesName": "Profit", "renderAs": "area", "showValues": "0", "data": [{ "value": "4000" }, { "value": "5000" }, { "value": "3000" }, { "value": "4000" }, { "value": "1000" }, { "value": "7000" }, { "value": "1000" }, { "value": "4000" }, { "value": "1000" }, { "value": "8000" }, { "value": "2000" }, { "value": "7000" }] }] } } ); revenueChart.render(); fusioncharts.render(); }) Attached picture show u the case. Any advise on that case how to solve it on ?

-
Sorry for later reply. It works . Thank you
-
Yes AreaSeries , exactly as the attached Picture
-
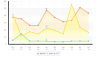
Hi, I want to do a gradient area chart like the attached. Can I achieve like that gradient? I find some example like Bar-Chart-With-Gradient-Example in Sencha Touch like https://gist.github.com/amrishodiq/1369480 Also I find it in sencha help . http://docs.sencha.com/touch/2.4/2.4.2-apidocs/#!/api/Ext.chart.CartesianChart-cfg-gradients But I dont know how to use it . Please advise.
-
Direct copy a new jpg file with same name to folder files/moban1380/ to replace the old one.